
Analyzing Image Review Charts
The Image Review Task type will produce accompanying charts and tables that are made accessible via the Charts summary overview. Like all Task charting outputs in Recollective, you can filter your results by Segment group or select Participants using the controls in the top right of your page.
Customizable Heatmap
The first output presented for an Image Review Task is a heatmap that can be customized by the included markers, image region selection as well as other options. If your Task setup called for a rating, the average rating will be displayed in the top right.

Using the marker drop-down menu, you can choose to produce a heatmap output consisting off all markers, an individual output per marker or any combination of markers. There's also a control to only include annotated markers.

Using the Select Region switch, you can create a data view window that can be resized and repositioned on the image to focus in on select areas of interest. When analyzing a certain region of the image, all resulting chart and table outputs will update to only show the data within the selected portion of the image.

There is also a Customize switch that can be used to then edit and visually optimize your heatmap for export. Everything from the Image Opacity, Marker Size, Heatmap Size and Heatmap Sensitivity can be controlled to produce the ideal image for export.

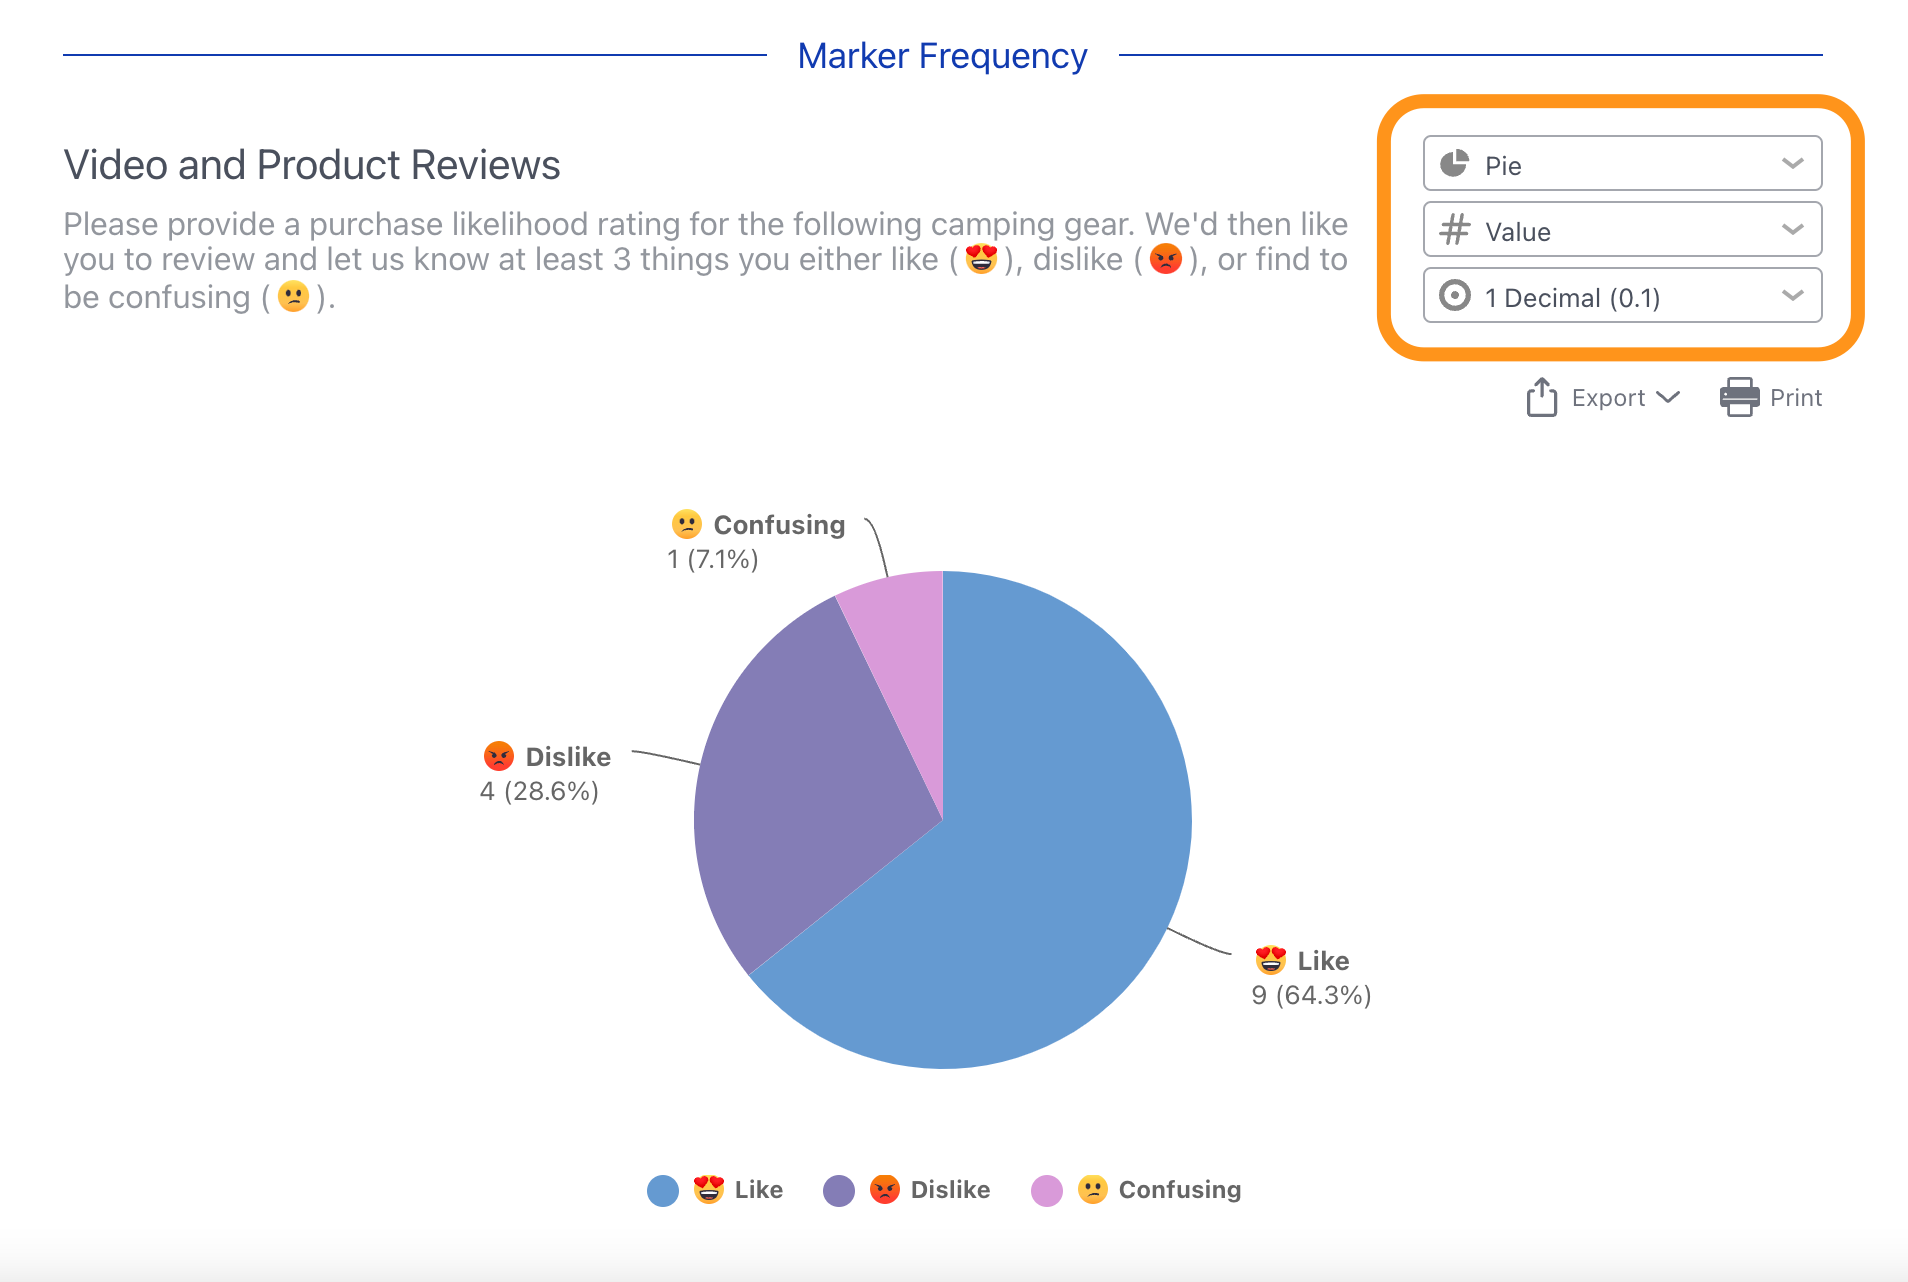
Marker Frequency Chart and Table


Response Data Tables
The Image Review Task will also provide Response Data tables. The first table presented here is the Responses table. This table contains a breakdown of the participants who contributed to the Task, their provided ratings (if included in the Task setup) as well as the number of markers they placed.

The second table found here is a Markers table that shows each marker's placement as an individual row and indicates the participant who placed it, the marker used, its relative placement and the associated comment.

The data from both of these tables can be exported to CSV using the dedicated option towards the top right of each table's section. The export will also include more information that will be pertinent for analysis (e.g. participant metadata).
