Analyzing Grid Charts
The Grid Task type will produce accompanying charts and tables that are made accessible via the Charts summary overview. Like all Task charting outputs in Recollective, you can filter your results by Segment group or select Participants using the controls in the top right of your page.
Distribution Chart
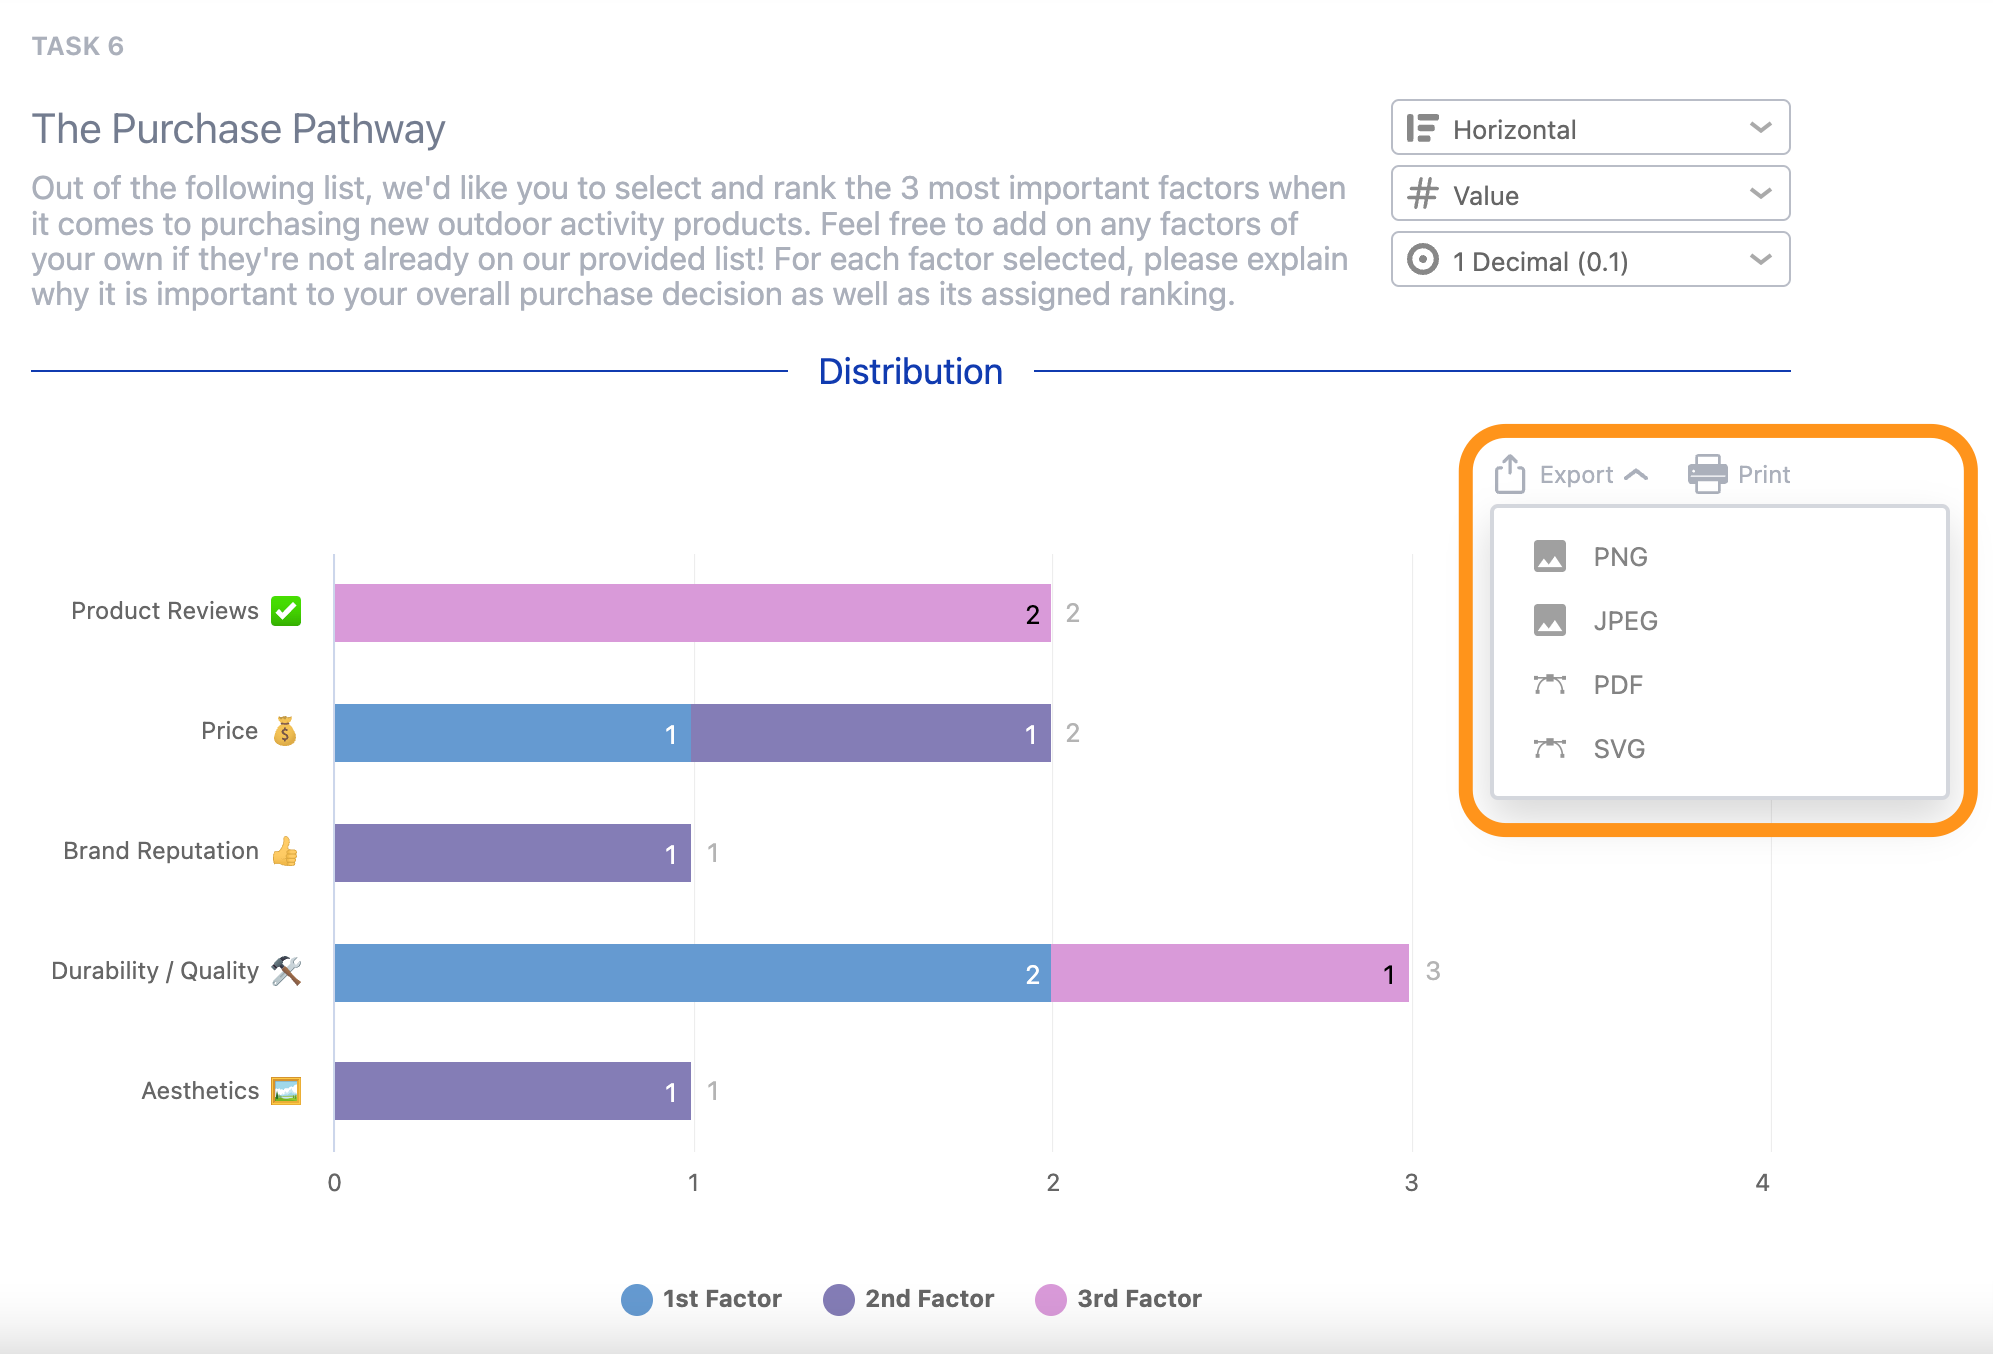
The first output presented for a Grid Task is a Distribution chart that can be customized in a variety of ways. Using the controls offered in the upper right, you can change the chart from a horizontal stacked bar chart to a vertical one, choose to display the chart values as counts or percentages, and modify the precision scale.
The rows that make up your Grid Task will all be displayed as individual chart elements that then have stacked colored bars representing the column elements from your Task. The displayed counts (or percentages) represent the number of times each column was selected per row element. You can then use the dedicated export option to download the chart.
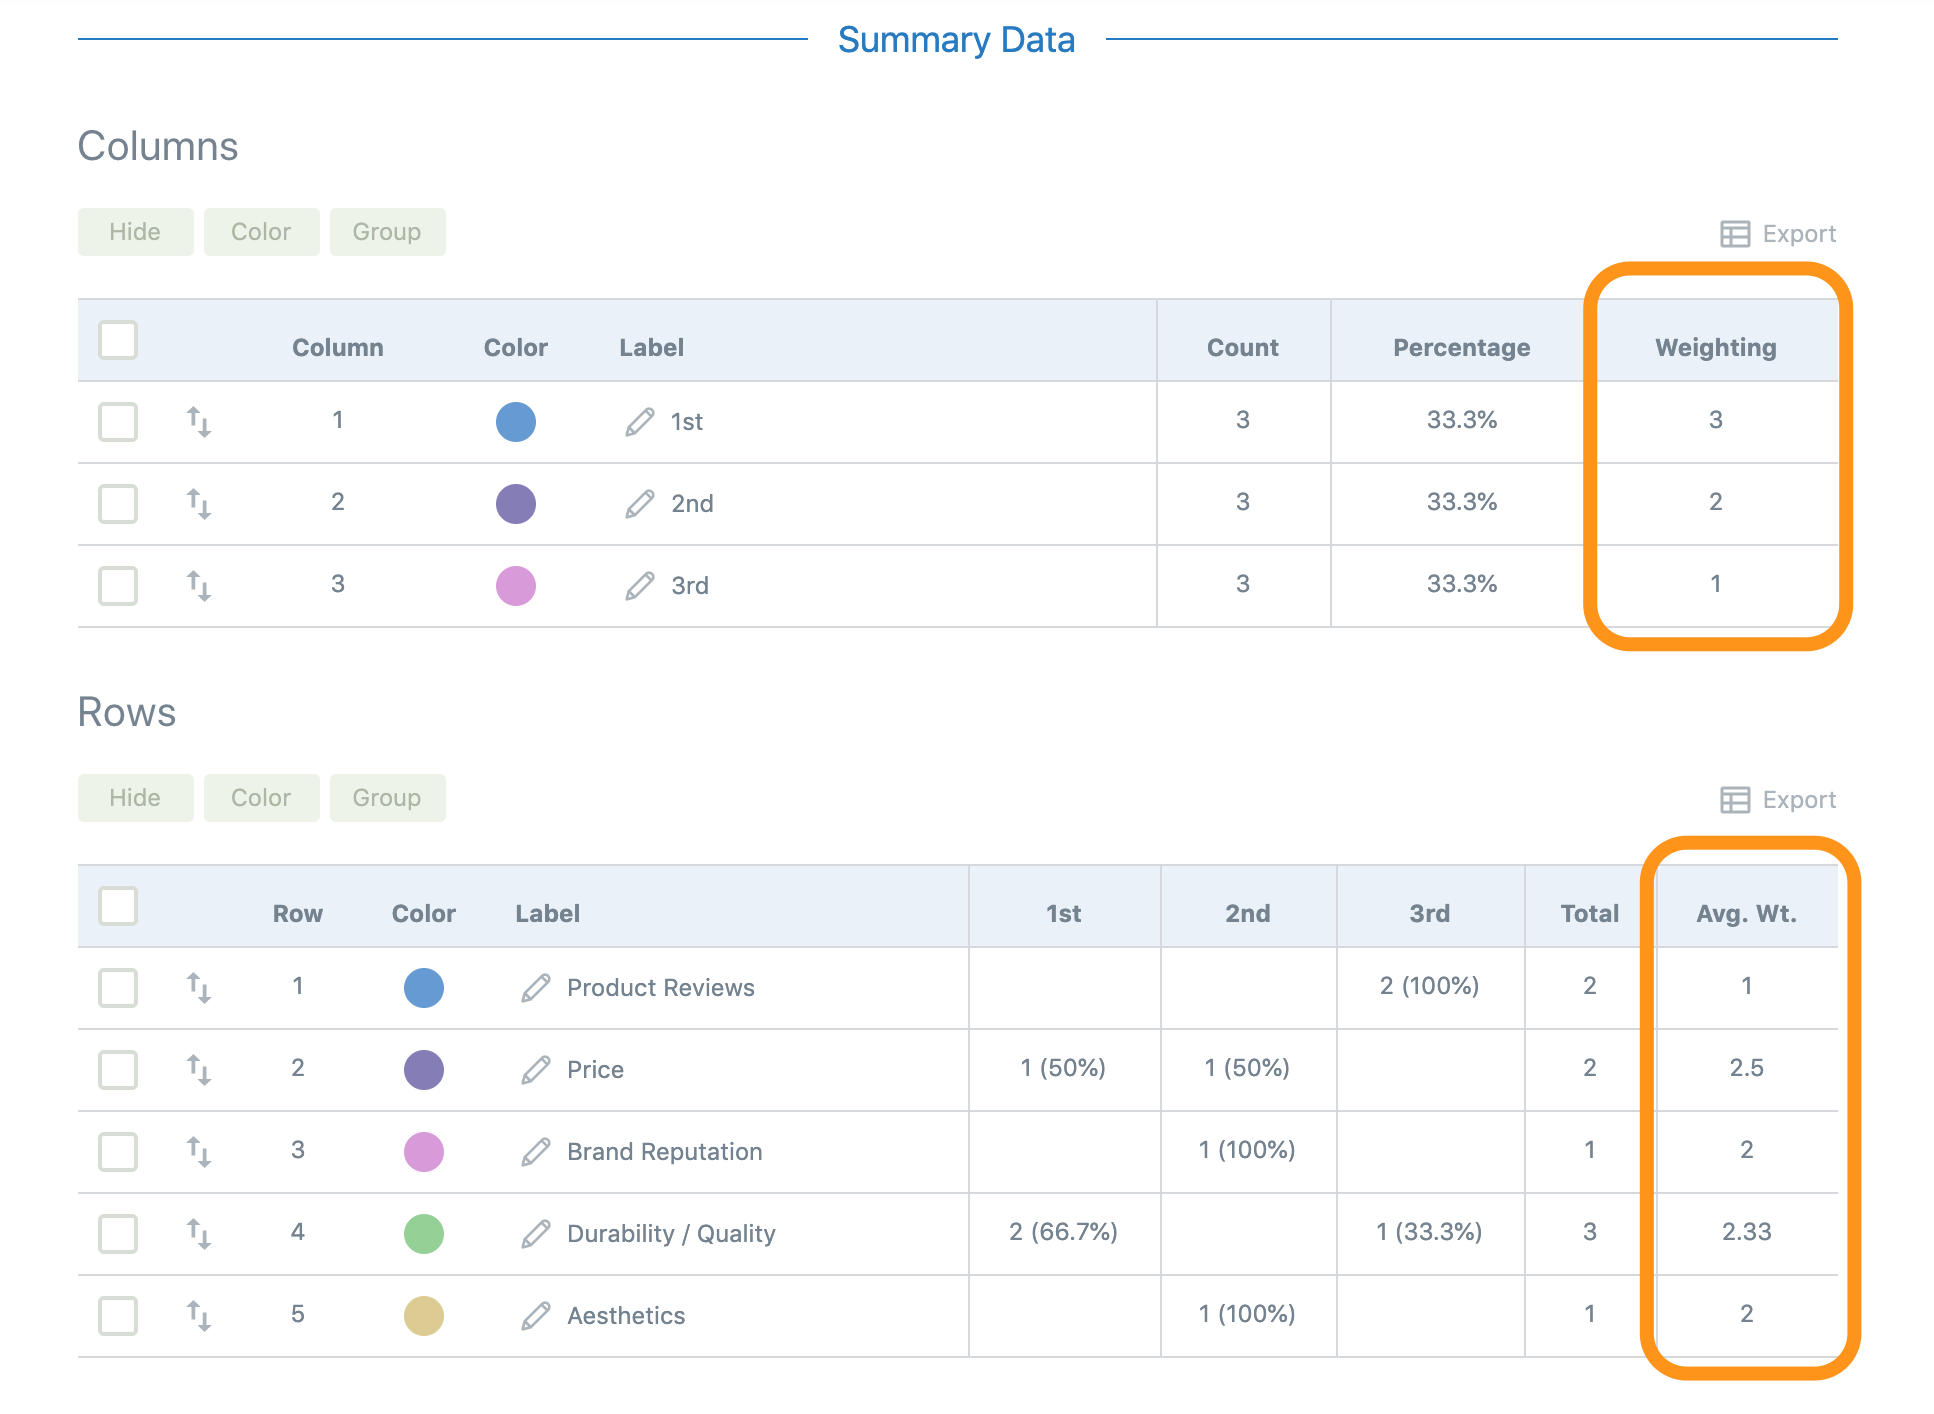
Summary Data Tables and Chart Customization
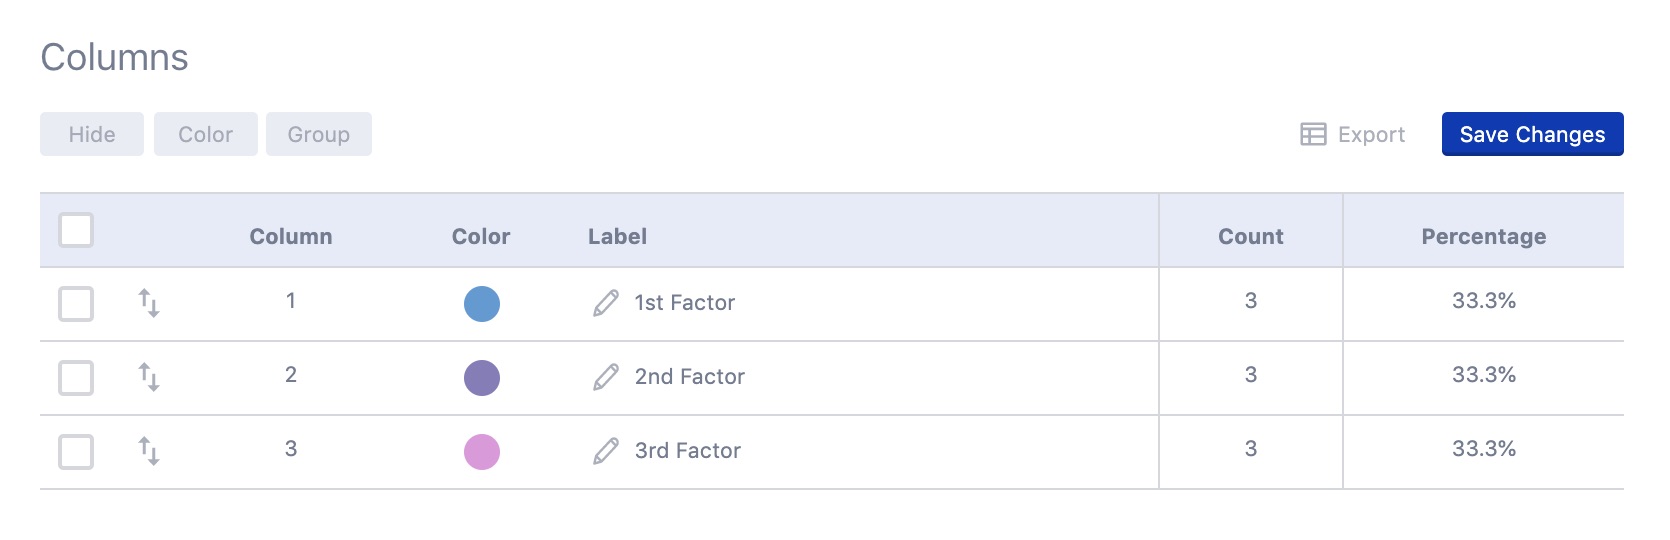
Below the Distribution chart, you'll find Summary Data tables that allow you to customize aspects that will then be reflected in the above chart and can be saved as the default going forward. The first displayed table summarizes the Columns and allows you to see a count and percentage for how many times it was selected.
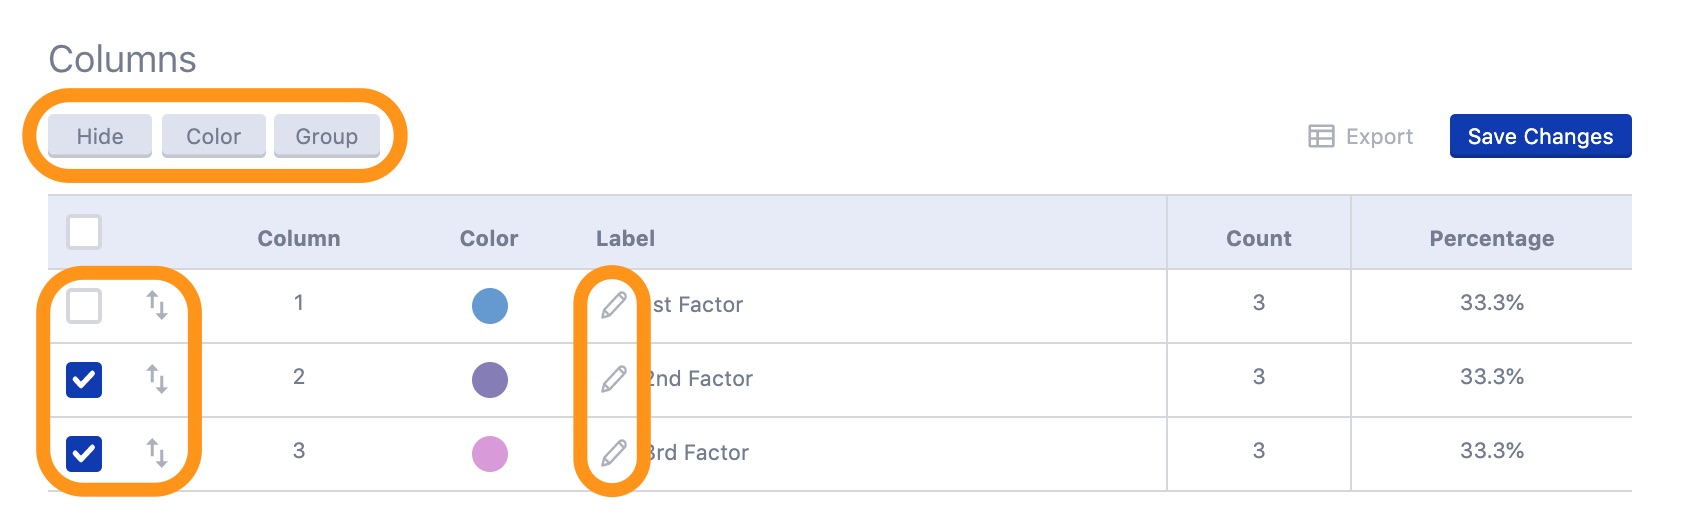
You can use the column checkboxes to select the desired column(s) which can then be hidden, have their colour edited (the default colors will be the ones chosen in
Study Settings: Appearance) or even be combined (e.g. collapsed categories). Use the handle icons to change the order of the groups and the pencil icon to edit the label name.
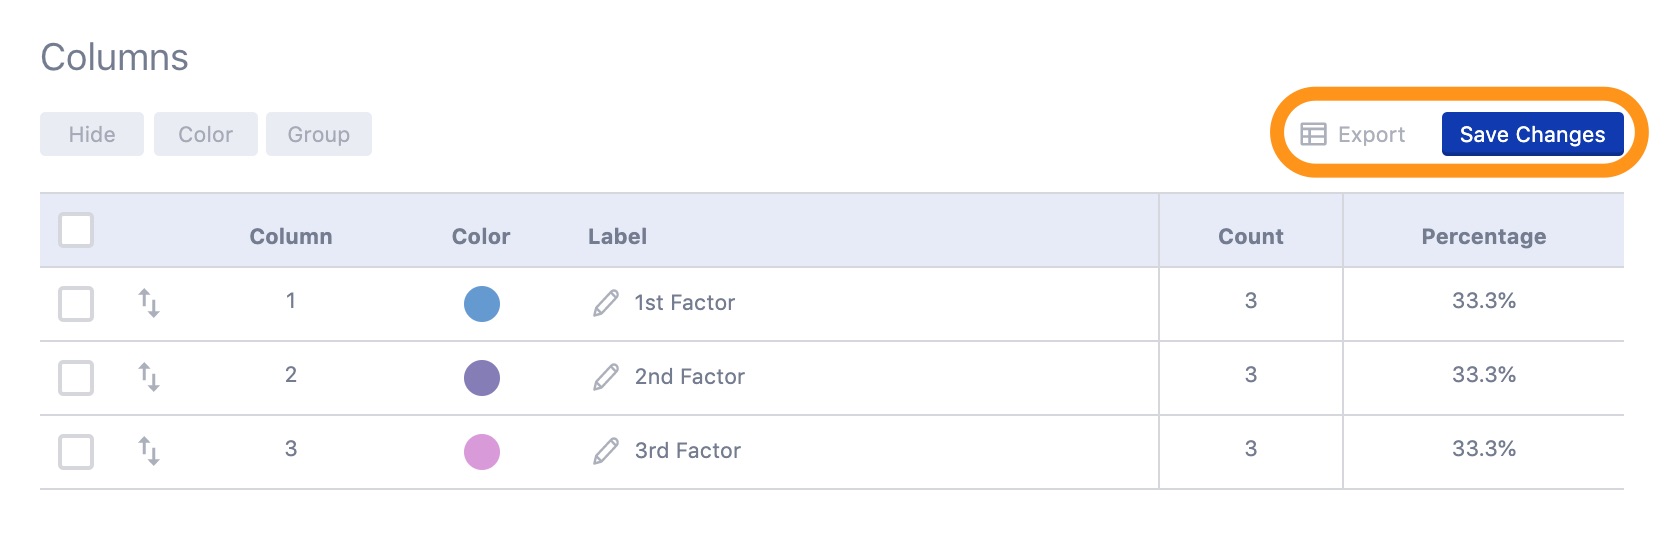
Finally, you can use the Save Changes button to commit any of your chart customizations as the default for others. The table data can also be exported using the dedicated option.
The second table summarizes the Rows and allows you to see the count and percentage of each column's selection as it pertains to each row element from your Grid Task. Similar to the Columns table, you can use the row checkboxes to select the desired row(s) to Hide or Group together in the Distribution chart.
You can also use the handle icons to change the order of the cards and the pencil icon to edit the label name. Finally, you can use the Save Changes button to commit any of your chart customizations as the default for others. The table data can also be exported using the dedicated option.
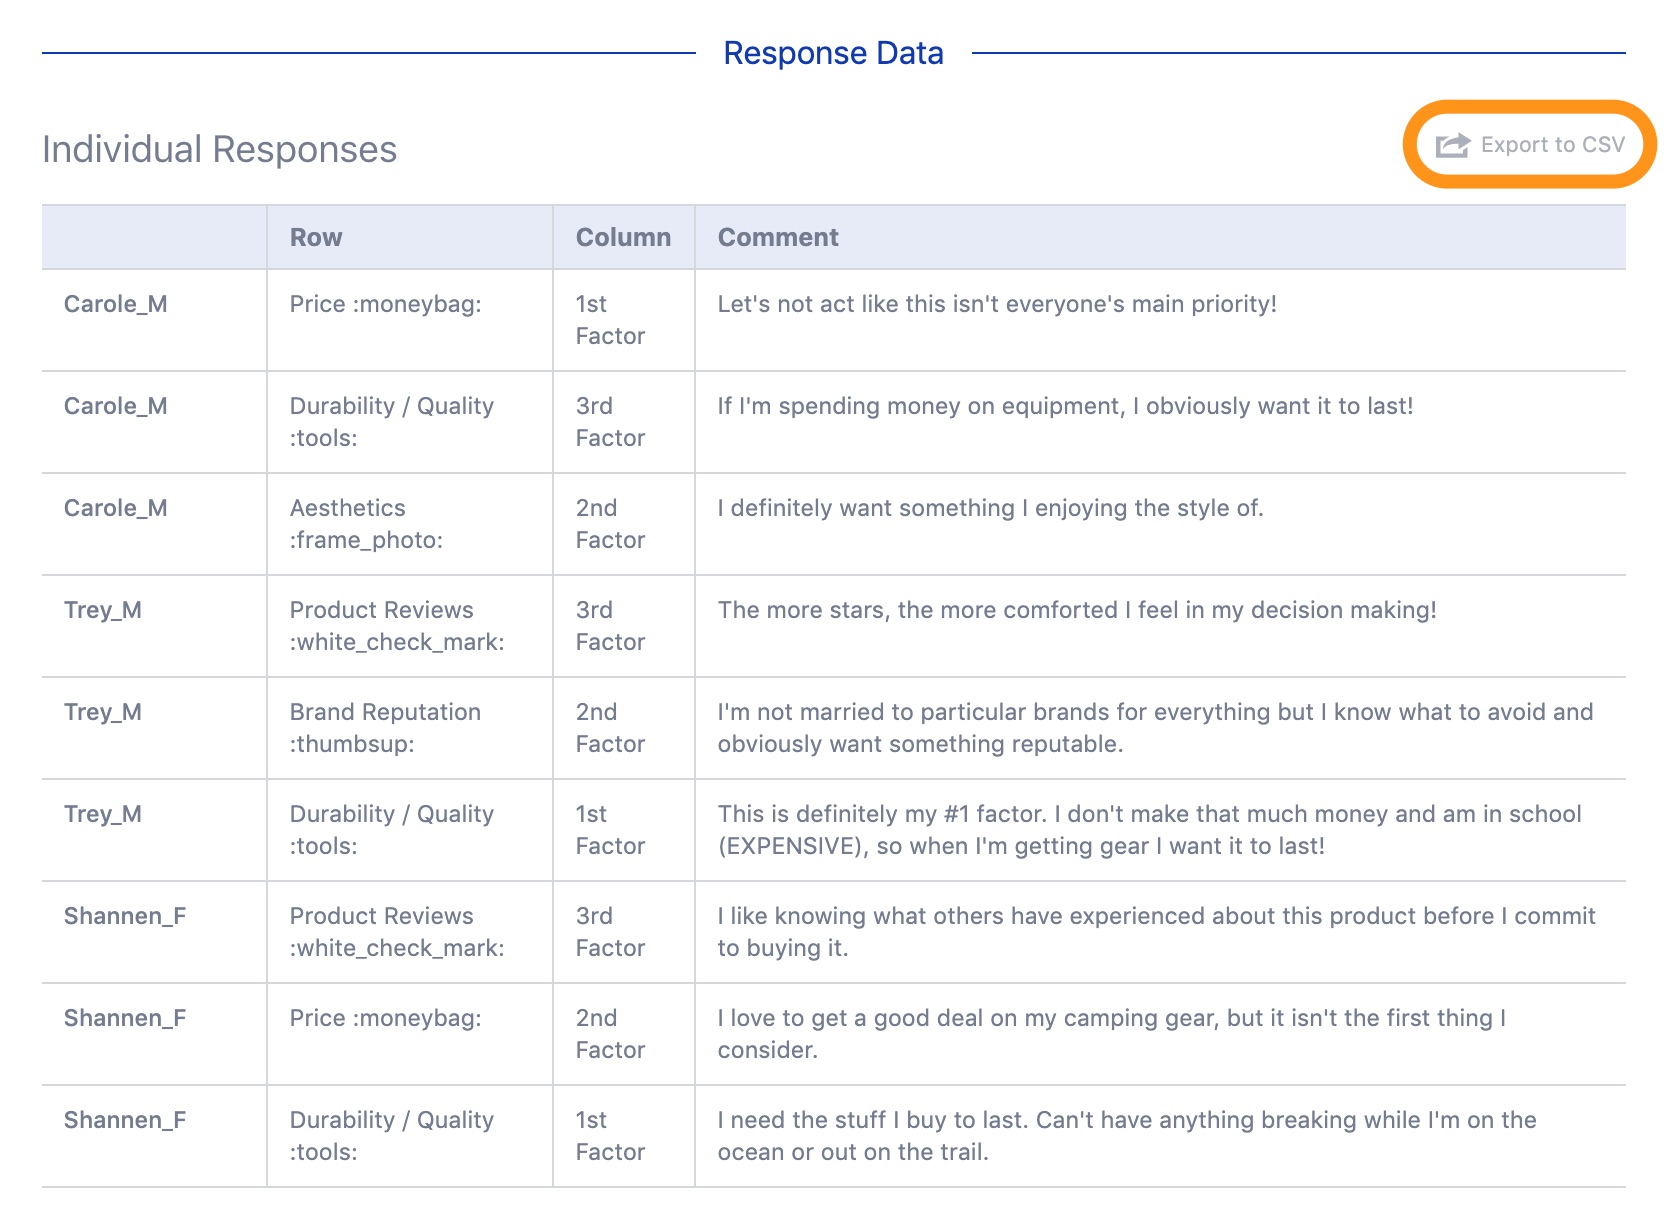
Response Data Table
Alongside the charts and tables referenced above, you'll also have a Response Data table at your disposal. The Individual Responses table will provide a breakdown of the participants, each row of the Grid, its received column ranking / selection as well as the comment received. The data from this table can be exported to CSV using the dedicated option towards the top right.
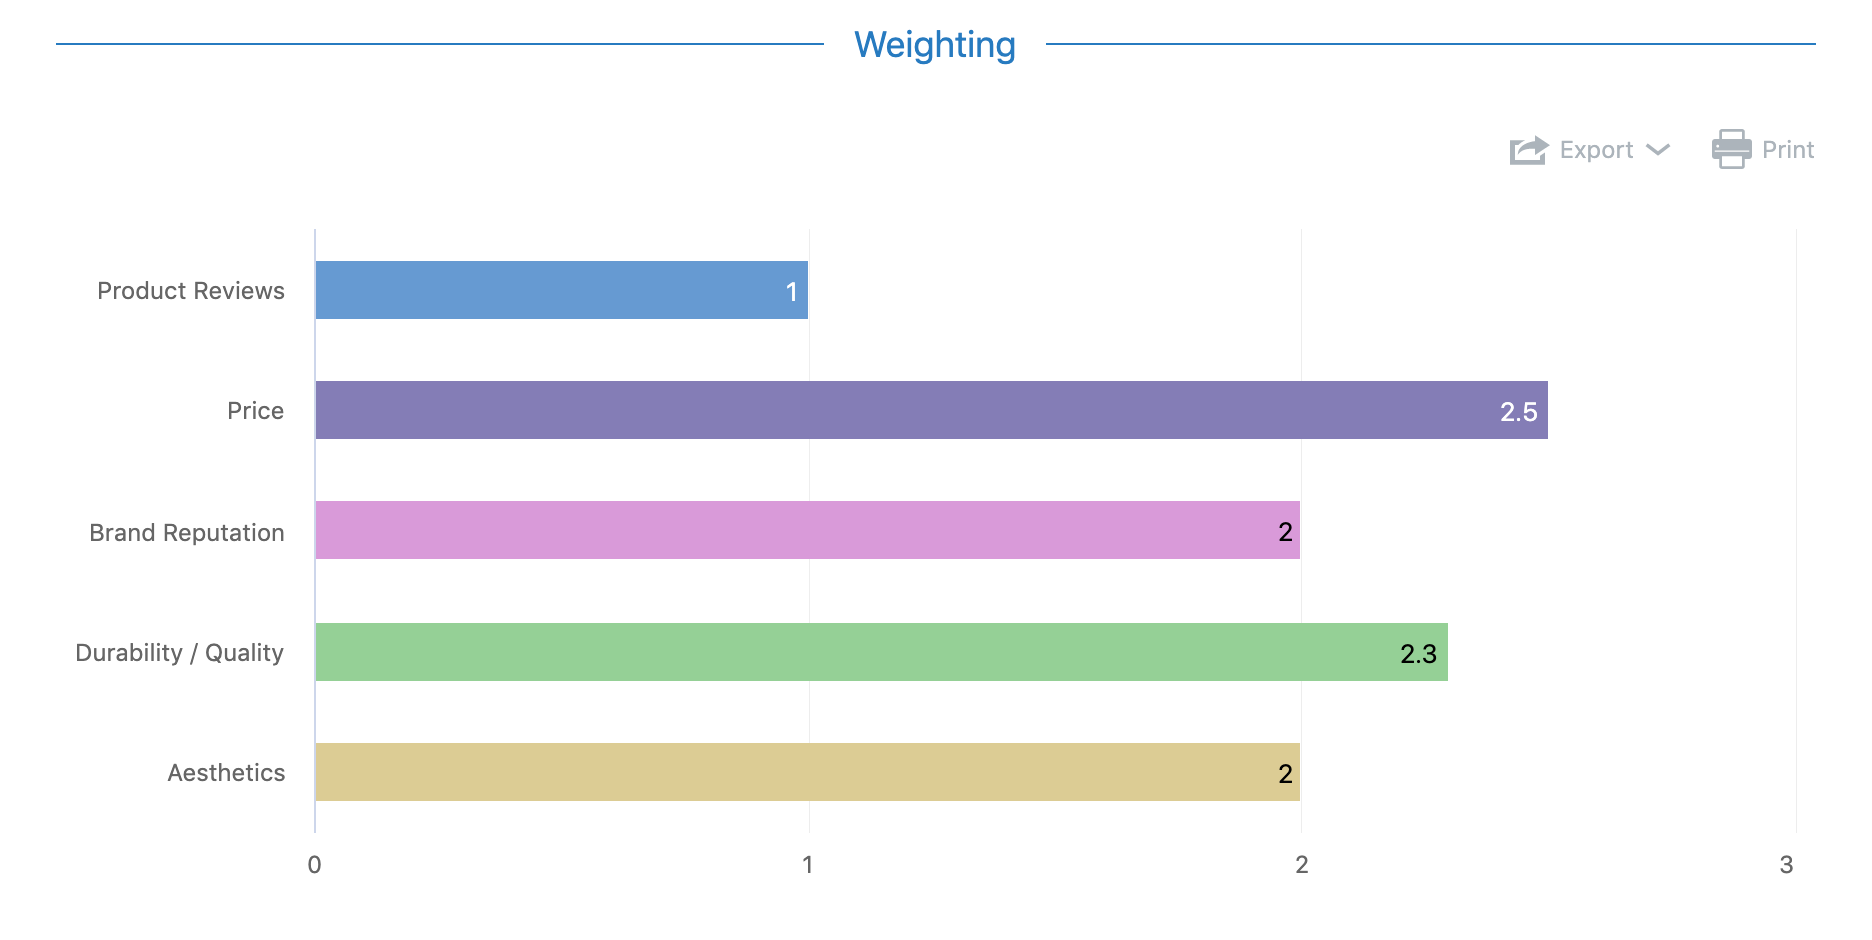
Weighting
Weighting your columns will result in a couple of changes to your output. First, you will get an additional chart that breaks down the weighting for each of your rows (You can review our Task Type: Grid article for more information on what the weighting per row means and how it is calculated). You can also view this Weighting chart with percentage values instead, in which case you just need to hover over the bar for a particular row item to view the average weight:
In addition to your new Weighting chart, each of your summary data tables will now have a column dedicated to weighting. The Columns table simply indicates the weight for each of your column elements as defined during Task setup, while the Rows table indicates the average weight for each row item.
In the following example, since we attributed more weight to elements that were ranked higher, we can order things from highest to lowest based on the average weights. As a result, we can say that price is the most important purchasing factor, followed by durability / quality, brand reputation and aesthetics (which were tied), while product reviews were the least important.
🗣️: Still have questions or want to leave feedback on how we can do better? Contact us at helpdesk@recollective.com.


