
Analyzing Sort & Rank Charts
The Sort & Rank Task type will produce accompanying charts and tables that are made accessible via the Charts summary overview. Like all Task charting outputs in Recollective, you can filter your results by Segment group or select Participants using the controls in the top right of your page.
Distribution Chart
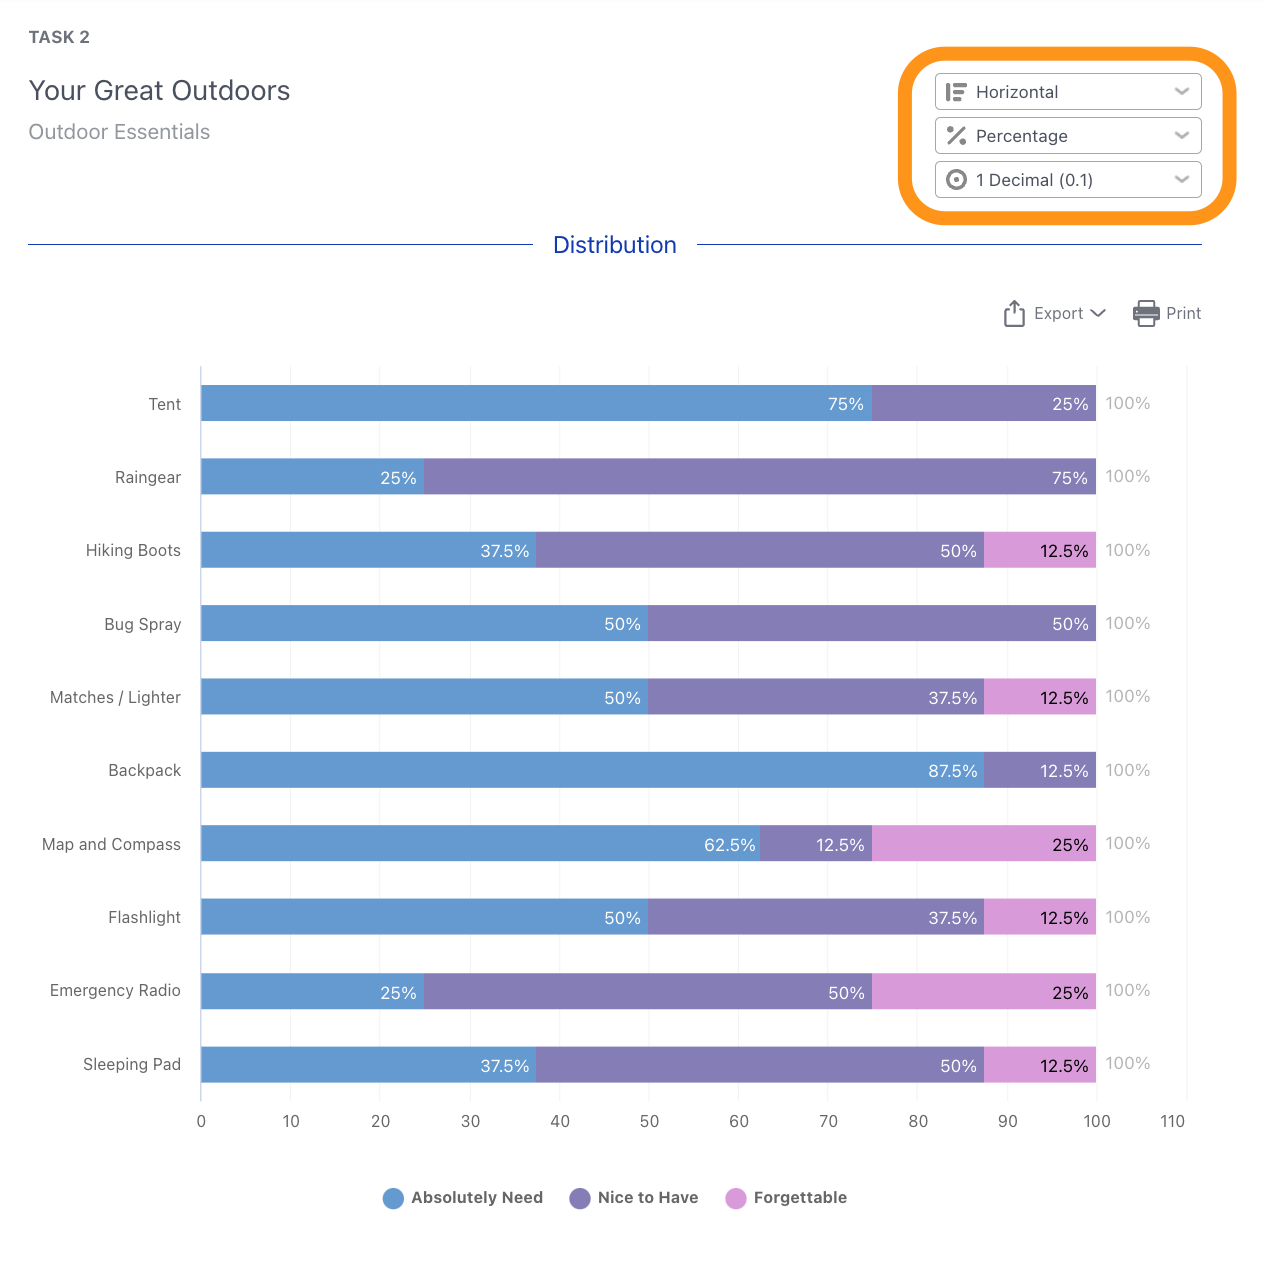

Summary Data Tables and Chart Customization
Below the Distribution chart, you'll find Summary Data tables that allow you to customize aspects that will then be reflected in the above chart and can be saved as the default going forward. The first displayed table summarizes the Groups and allows you to see a count and percentage for how many cards were placed in each group.

You can use the group checkboxes to select a group or groups which can then be hidden, have the colour edited (the default colors will be the ones chosen in Study Settings: Appearance) or even combine groups (e.g. collapsed categories). Use the handle icons to change the order of the groups and the pencil icon to edit the label name.

Finally, you can use the Save Changes button to commit any of your chart customizations as the default for others. The table data can also be exported using the dedicated option.

The second table summarizes the Cards and allows you to see the count and average rank of a card per group as well as across all groups (i.e. overall). The ranking component allows you to get at a sense of the card's prioritization within the group(s).
For example, you might have two cards placed in a group the same number of times, but if your question calls for people to order the cards, you can reference the average ranking scores (in-group or overall) to see which was a higher priority.
Please note that the cards' overall and in-group ranking values will always be generated regardless of whether your question asked people to order their card placements. You should only reference these stats if your question had a ranking component involved. If your Sort & Rank Task only asked people to rank cards within a certain group, you'll only want to reference that group's ranking score.
The Average Rank score is only relevant in cases where participants were supposed to order the cards in each respective group. If using this statistic it also assumes that each group used the same anchors or spectrum with which to order the cards (e.g. most to least relevant) as well.


Response Data Tables
Alongside the charts and tables referenced above, you'll also have Response Data tables at your disposal. The first table shown is a Responses table breaking down the participants, total number of cards they used, the card distribution across the different groups, etc. The data from this table can be exported to CSV using the dedicated option towards the top right.

The second table is an Individual Entries table that shows each card's placement as an individual row and indicates the participant who used it, the card and group, the card position as well as total number of cards placed in that group by the participant. The data from this table can also be exported to CSV using the dedicated option towards the top right. The Response Data table exports will also include more information that will be pertinent for analysis (e.g. participant metadata).
